Background
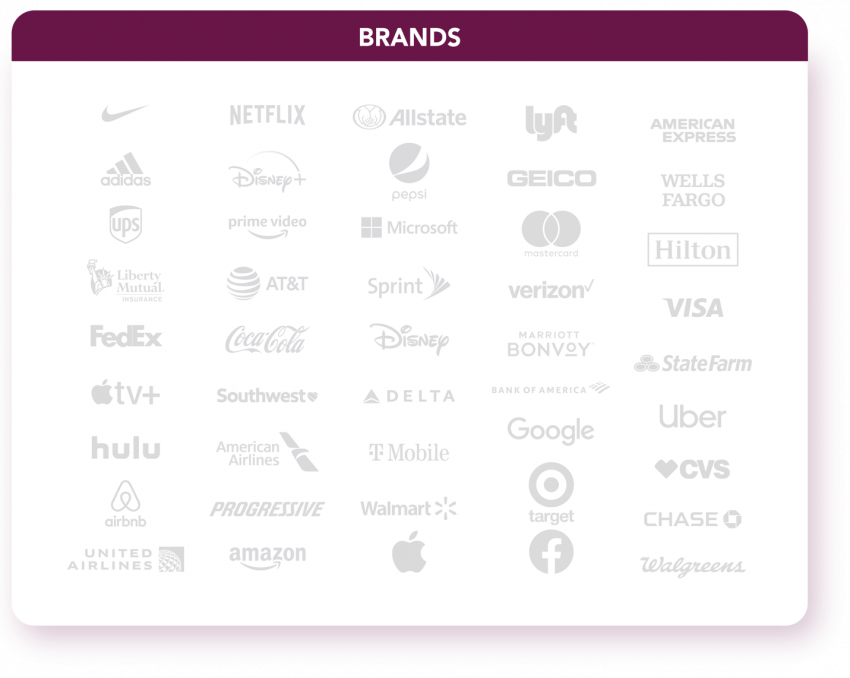
It is essential for brands to find unique ways to gain a competitive advantage by differentiating themselves from their competitors. The Zion & Zion market research team is engaged in an exclusive in-depth series of studies to understand how consumers perceive the personalities of top U.S. brands. This article is the second in our new series on 45 major brands in 15 industries (see tables 1 and 2). In this series, we analyze how top brands are perceived across three key brand personality scales: Aaker’s (1997) classic five dimensions of brand personality; Freling, Crosno, and Henard’s (2011) brand personality appeal dimensions; and Haji’s (2014) negative brand personality dimensions. In the first article of our series, we investigated the classic five dimensions of brand personality by Jennifer Aaker. In this article, we explore six other dimensions of brand personality. In future articles, we will highlight the impact various brand personality dimensions have on brand performance, perform deep-dives into the 15 industries and more.
Table 1. Industries Included in this Study
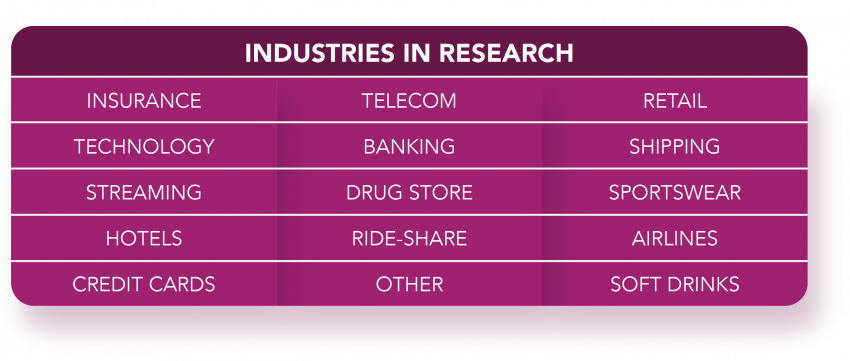
Table 2. Brands Included in this Study
EXECUTIVE SUMMARY
The Zion & Zion research team sought to gain a deep understanding of the brand personalities of 45 top brands in the U.S. The brands were selected based on established brand value and industry leadership rankings. We surveyed 9,309 adults, 18 years of age and up. Each respondent was asked about one of the brands. Respondents in our survey were also asked to rate their familiarity with each brand on a scale of 1 to 7, with 1 being “very unfamiliar” and 7 being “very familiar.” Only respondents who answered with at least “somewhat familiar” (5 or higher) were retained for the study which resulted in a data set of 6,444 responses.
In this article, we shed light on the Freling et al. (2011) brand personality appeal dimensions and Haji’s (2014) negative brand personality dimensions. We provide a high-level overview of results for these two scales, which substantially broaden our understanding of brand personality beyond the classic five dimensions of the Aaker scale, the subject of our first article in this series. We show that major brands are characterized by a range of brand personalities, including negative aspects of consumers’ view of their personality.
Brand Appeal and Negative Brand Personality
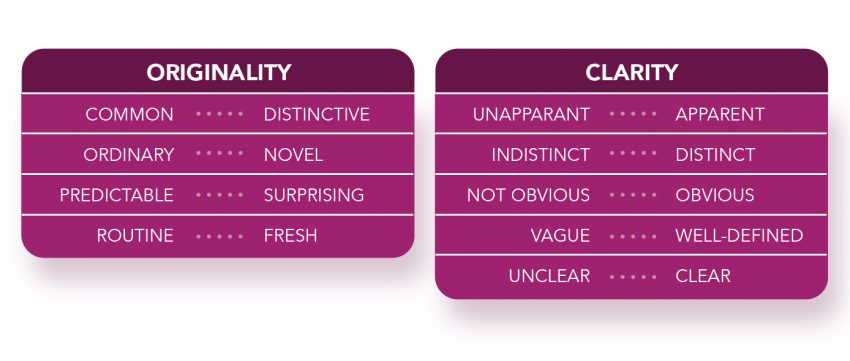
Understanding the personality of any brand requires a multi-faceted approach. Our large database describes the brand personality of each of the top 45 brands using the brand personality appeal scale and the negative brand personality scale. The Freling et al. brand personality appeal scale (BPA) measures the dimensions of Clarity and Originality of the brands in our study. In this scale, a total of 9 traits describes the appeal of each brand’s personality (see table 3 for a summary of the traits and dimensions). While the Aaker scale from our first article describes the character of each brand’s personality, the Freling et al. BPA approach highlights the overall impact of the resulting personality. The BPA investigates whether the personality, seen in totality, creates a clear brand image and whether that image is original, i.e., a distinctive presence in the marketplace.
Table 3. Structure of the Brand Appeal Scale
Freling et al. suggest that “…there are benefits to having a favorable brand personality, such as enhanced brand attitudes and purchase intentions and higher levels of consumer trust and loyalty.” (Page 392) In their article, they maintain that it is the overall appeal of the brand’s personality that influences target consumers’ purchase decisions and helps to sustain the endurance of a brand especially across promotional cycles.
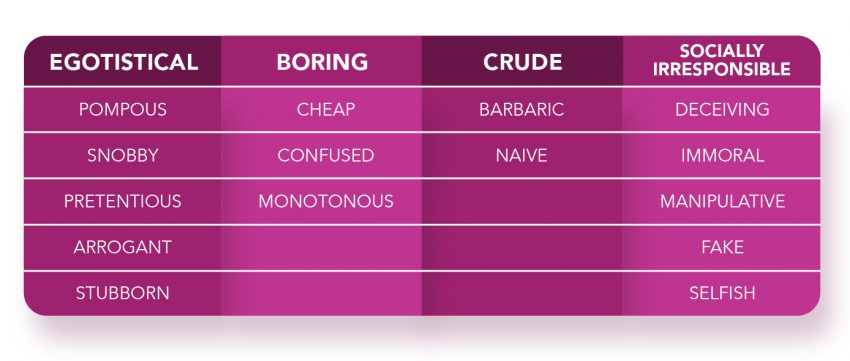
The Haji Negative Brand Personality scale (NegBP) measures the dimensions of Egotistical, Boring, Crude and Socially Irresponsible. In this scale, a total of 15 traits describes the negative side of each brand’s personality (see table 4 for a summary of the traits and dimensions). The NegBP extends our understanding of each brand by highlighting the dark side of each brand’s perception. Brands can be seen in a negative light due to their actions or their products, for example Facebook’s lack of privacy controls or Wells Fargo’s fake accounts scandal. We will show in a later article in our series that these often-overlooked traits are important drivers of a brand’s marketplace success.
Table 4. Structure of the Negative Brand Personality Scale
Combined, the BPA and the NegBP scales significantly extend our understanding of brands and their personalities. Aaker’s classic scale allows for firms to measure their brand’s perceived personality; however, it does not allow them to quantify the positive or negative feelings toward the personality or how these personalities interact with a consumer’s willingness to do business with the brand in the future. An attribute that is perceived as satisfying will be viewed more favorably and will result in a more positive attitude toward the brand. Conversely, an attribute that is not perceived as satisfying will be regarded as unfavorable and will result in a more negative attitude toward the brand.
To measure the BPA and the NegBP, the Zion & Zion research team asked each respondent to assess how well each trait describes one of the 45 brands. The BPA traits were presented on a semantic differential scale of 1 to 7, with 1 and 7 representing the polar ends of each trait. For example, for one of the traits for the originality dimension, 1 represents “common” and 7 represents “distinctive”. We show all 9 pairs of descriptions in table 3. For the NegBP scale, the traits were presented on a scale of 1 to 7, with 1 being “not descriptive at all” and 7 being “extremely descriptive.” We show all 15 traits in table 4. Each question in the survey was displayed randomly to each respondent to help avoid ordering effects or respondent fatigue. The personalities were calculated by averaging each trait associated with each of the 2 BPA dimensions, and with each of the 5 NegBP dimensions.
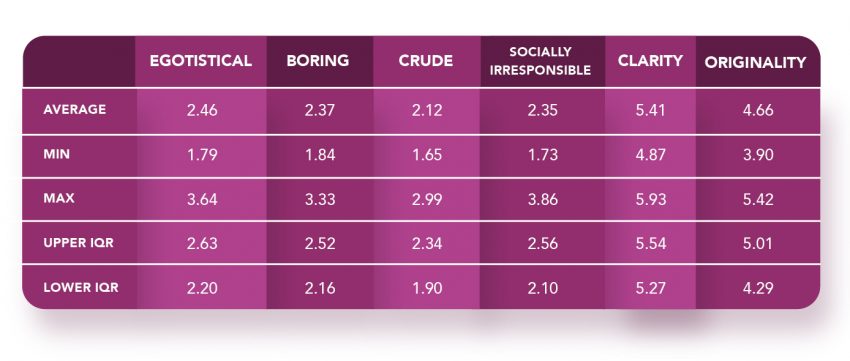
When comparing the two BPA dimensions to each other (Chart 1), we find that the top brands score higher on Clarity than on Originality. Our interpretation of this finding is that the major brands in our study manage to be clear about who they are but are not seen as very original. A look at the NegBP dimensions reveals that the major brands in our study score highest (i.e., worst) on Egotistical, followed by Boring and Socially Irresponsible, while scoring lowest on Crude. This finding highlights that Crudeness is less of a perception problem for our brands than the other 3 negative dimensions.
Chart 1. Middle scores and Ranges across all 45 brands
Our 45 Brand Personalities
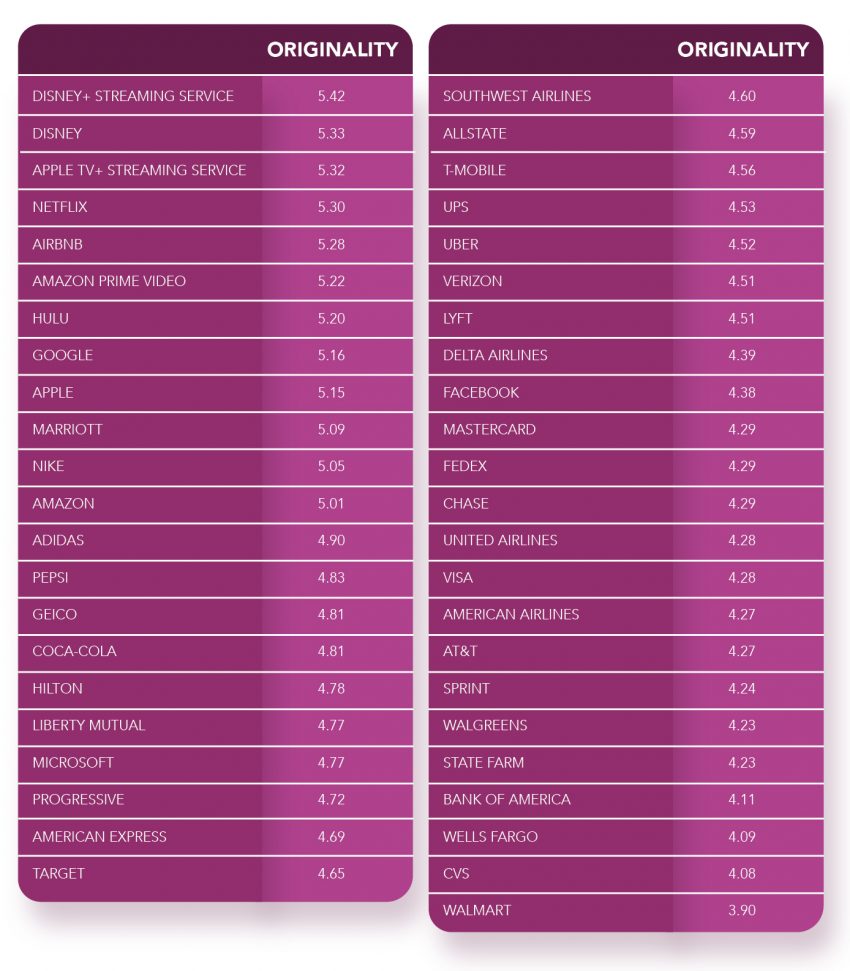
The following charts (charts 2-7) show the BPA and NegBP personalities of our 45 major brands. For each of the six dimensions, we use one chart to display the average score of each brand’s personality in comparison with the personalities of all other brands. In the charts, each brand is represented by a line reflecting the score that the brand is rated at for each of the dimensions by consumers. We also display the 80% confidence interval of that perception, allowing for an estimate of statistical difference comparisons across brands. It is important to remember that while scoring high on Clarity and Originality is desirable, the picture reverses for the NegBP scores. Brands will want to score low on being seen as Egotistical, Boring, Crude and Socially Irresponsible.
We can see that, as a group, the 45 brands have varying scores across the six dimensions. No brand scores high on all BPA dimensions and low on all NegBP dimensions. The most consistent, but not desirable, picture emerges for Facebook, which has the highest, i.e., worst, scores on all NegBP and the lowest Clarity of all brands while the Originality of Facebook is middle of the road compared to the other leading brands. Disney’s brand is performing well across the board, leading the pack on Clarity and with its Disney+ Streaming Service leading all brands on Originality. Marriott has the lowest, i.e., most desirable, score on two of the four NegBP, Boring and Socially Irresponsible, while also coming in with low values for the other two NegBP. UPS has the lowest score for Egotistical and Visa is in the best position on being perceived as not Crude.
For each brand, we can track its personality scores across all 6 dimensions. We will provide a more detailed analysis of each brand in later instalments of our series.
Interpreting the Data
When interpreting the data shown on the charts, it is important to keep in mind that each brand has its own unique profile that needs to be understood in relation to the brand’s positioning and target segment. It would be misleading to see this as a competition where a brand is strong only if it scores high on all BPA facets and low on all NegBP facets. However, in contrast to the Aaker classic brand personality scale, it is generally true that brands would prefer to be seen as clear and original and would not like to be associated with negative traits. Brands can perform well if they have middling scores on all these dimensions, so this is not a hard and fast judgement, but brands would generally not like to be seen as scoring both, low on BPA, and high on NegBP. The caveat is that being perceived negatively by some consumers may be acceptable if the brand’s target segment sees the brand in a positive light.
Putting the Data to Work
This article is the second article in our multi-part series, where we looked at each of the brands in 15 industries in more detail. Later in this series, we will look at how each brand’s profile matches up with its competitors, what facets are key for market success in each industry, and we will also evaluate a series of industry-specific questions.
The Zion & Zion research team encourages marketers to look at how they want their brand to be viewed by consumers and look for ways to distinguish themselves from the pack. In our series we will show that by choosing specific areas to improve, brands can distinguish themselves from the pack. Our series can thereby show how such differentiation can help brands to gain a competitive advantage.
Charts 2-7. Dimension Average for all 45 brands
Chart 2. Egotistical
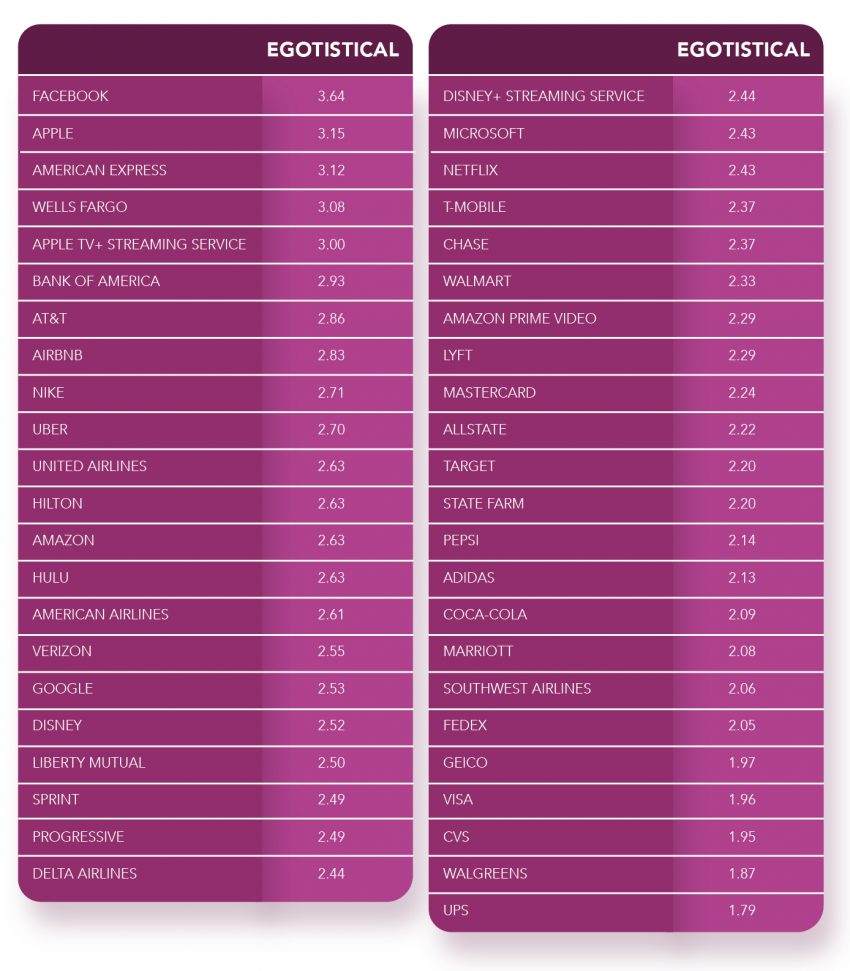
Chart 3. Boring
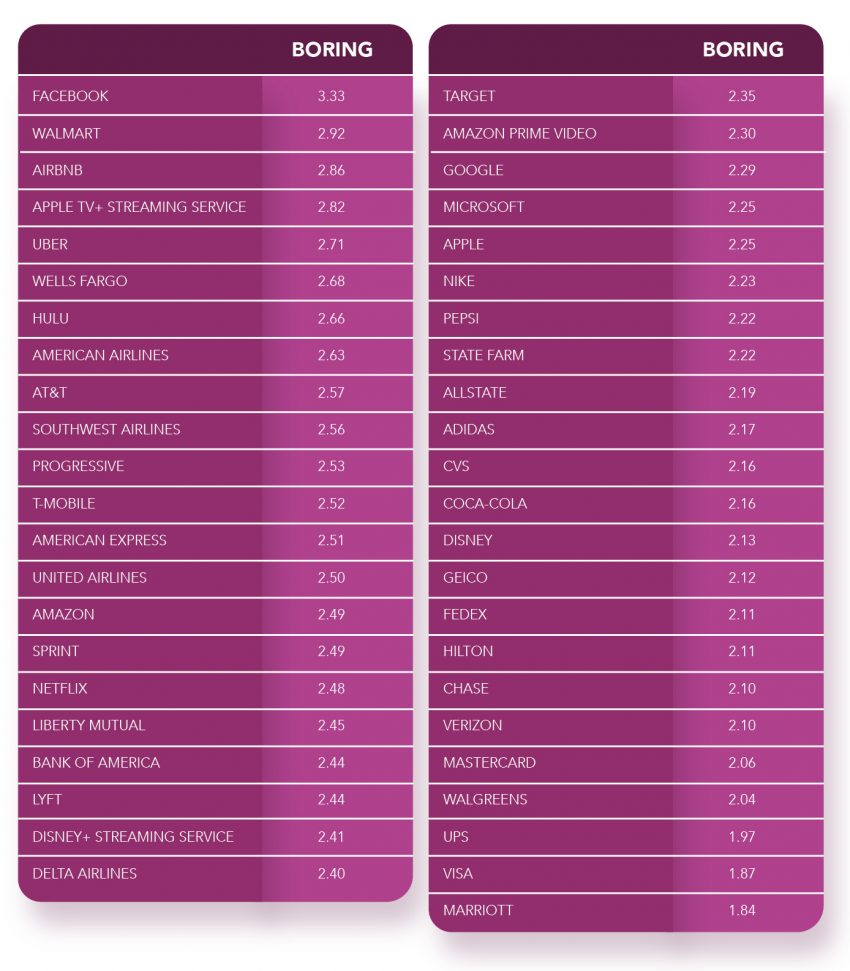
Chart 4. Crude
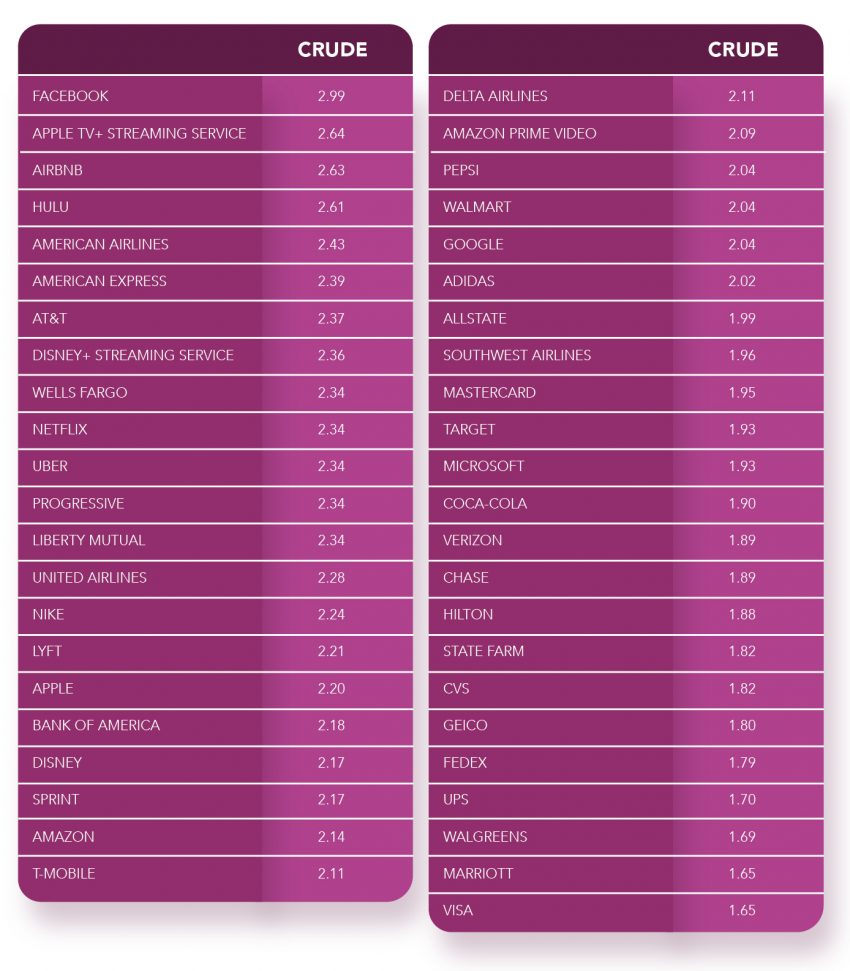
Chart 5. Socially Irresponsible
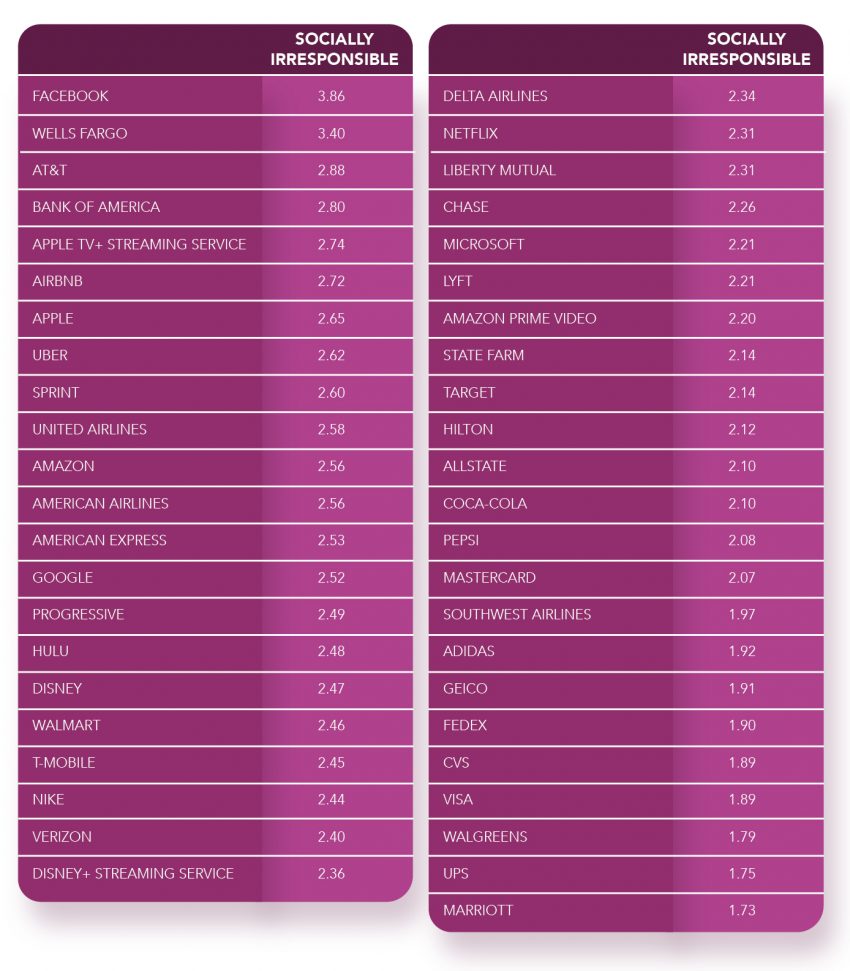
Chart 6. Clarity
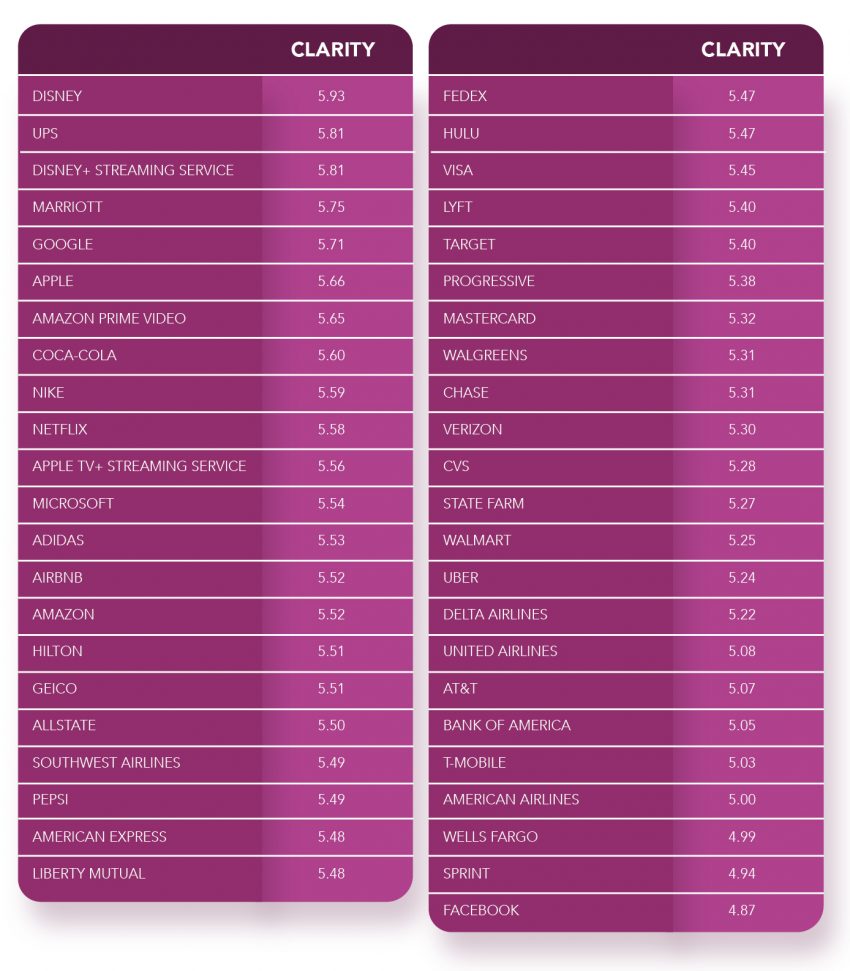
Chart 7. Originality
