There have been blog posts by others about why Google Analytics (GA) has a Weighted Sort (WS) and the Estimated True Value (ETV) algorithm that GA uses to perform Weighted Sort. Even so, there are several things that remain which, as a leading user experience and web analytics agency, we get questions about all the time, so we will address those here. Those questions are:
-
-
- What is the “English” interpretation of a list that has been ordered according to Weighted Sort?
- Since Google Analytics doesn’t actually show you the ETV, should one generate the ETV on one’s own, and if so, when and why?
- Since the Google Analytics Weighted Sort, i.e. the ETV algorithm, takes into account ALL of the data in the table to be sorted, how sensitive is the algorithm to exactly what data is in the table?
-
Before we get into answering the questions above, let’s do a short recap of WS and ETV.
Let’s say you’re looking at a table of device types and their respective bounce rates so that you can identify which devices may have issues viewing your site. Below is such a table, and you can see that the average bounce rate for all devices is 51.98%. Note that there are several hundred rows of data in the table, but for simplicity, we’re just showing the first ten rows here.
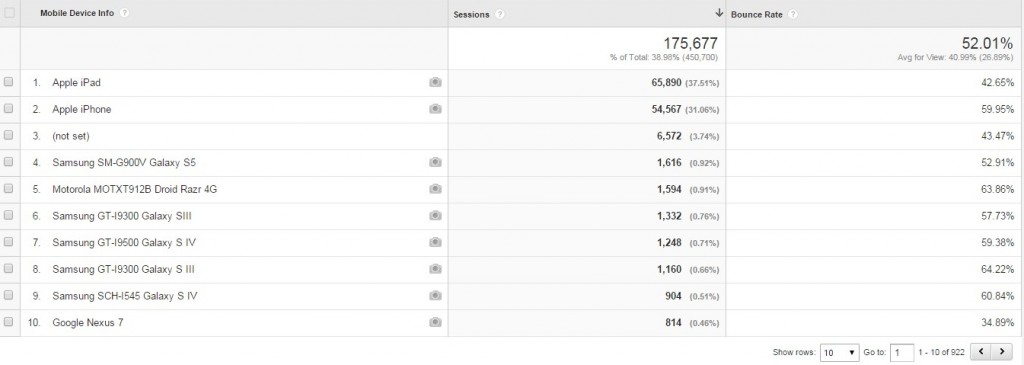
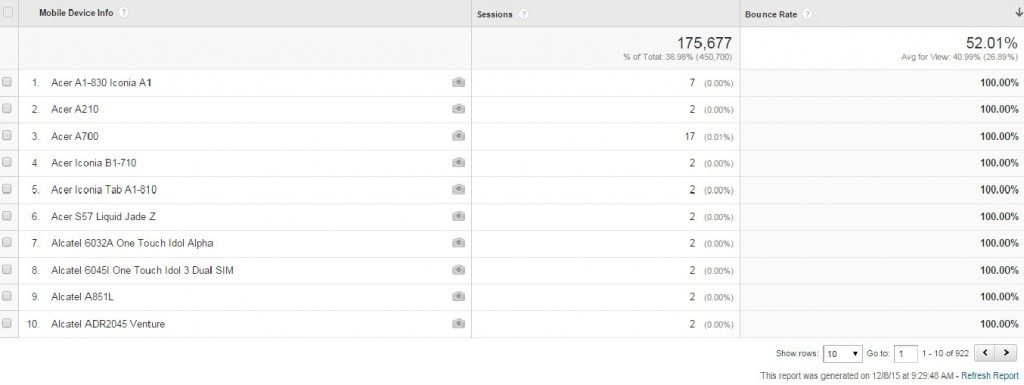
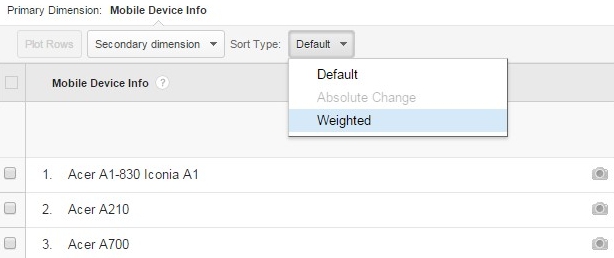
Which yields the following ordering.

The ordering that Google Analytics’ Weighted Sort produced is based on calculating the Estimated True Value (ETV) and using the ETV as a score on which to sort. The ETV computation is performed for each row of data as follows:
ETVrow x = (F2 / F2 max * F1) + ((1 – F2 / F2 max)) * F1 avg)
F1 = Bounce Rate for the row (i.e. the “factor” you want to weight)
F2 = Sessions for the row (i.e. the “factor” that will modify the significance of F1)
F2 max = The highest number of sessions found in any row of the table (i.e. the maximum value of F2)
F1 avg = The Bounce Rate for the table (i.e. the average of F1)
For some extra clarity, here is the equation, but with the variables replaced with Bounce Rate and Sessions.
ETVrow x = (Sessionsrow x / Sessions row with the most sessions * Bounce Raterow x) + ((1 – Sessionsrow x / Sessions row with most sessions)) * Bounce Rateentire table)
Question 1: What is the “English” interpretation of a list that has been ordered according to Weighted Sort?
Here are the two components to the ETV calculation.
The first is: (Sessionsrow x / Sessions row with the most sessions * Bounce Raterow x)
And the second is: ((1 – Sessionsrow x / Sessions row with most sessions)) * Bounce Rateentire table)
The first part says, “Weight the Bounce Rate for this row (i.e. Bounce Raterow x) by how important this row’s Bounce Rate is as determined by the ratio of the number of sessions in this row compared to the row with the highest number of sessions (i.e. Sessionsrow x / Sessions row with the most sessions).”
The second part says to compute how heavily to weight the Bounce Rate for the entire table. Specifically, “Weight the Bounce Rate for the entire table (i.e. Bounce Rateentire table) by how important the entire table’s Bounce Rate is as determined by one minus the ratio of the number of sessions in this row compared to the row with the highest number of sessions (i.e. 1 – Sessionsrow x / Sessions row with the most sessions).”
The ETV calculation essentially says, “I need to figure out whether the row of data that I’m looking at is a large or a small percentage of the data in the whole table. If it’s a large percentage, then I need to take this row seriously in the sense that the data is probably meaningful. If it’s a small percentage, then I shouldn’t take this row seriously, and the reality is that I’d probably be more ‘correct’ if I just leaned towards using the average Bounce Rate for the whole table. So the ETV calculation has two parts to it. One that computes how heavily to weight the Bounce Rate that is shown in the row, and another that computes how heavily to weight the average Bounce Rate for the entire table. And, the more I weight the Bounce Rate for the row, the less I weight the Bounce Rate for the entire table; and vice versa.”
Question 2: Since Google Analytics doesn’t actually show you the ETV, should one generate the ETV on one’s own, and if so, when and why?
—AND—
Question 3: Since the Google Analytics Weighted Sort, i.e. the ETV algorithm, takes into account ALL of the data in the table to be sorted, how sensitive is the algorithm to exactly what data is in the table?
You may indeed benefit from generating the ETV values on your own since Google Analytics does not provide them. Let’s look at some data to see why.
The data we were looking at earlier had 992 rows. We’ve gone ahead and computed the ETV for each of those rows, and have shown the first 15 rows of data here sorted by ETV. Looking at these rows, you can see that the first row shows that the Estimated True Value of the Bounce Rate on the Apple iPhone is 58.59% and that the next 14 rows of data all have ETVs of around 52%. Looking at that, you would correctly note that rows 2 through 14 are essentially the same with respect to their Estimated True Bounce Rates, i.e. they range from 52.30% to 52.09%.
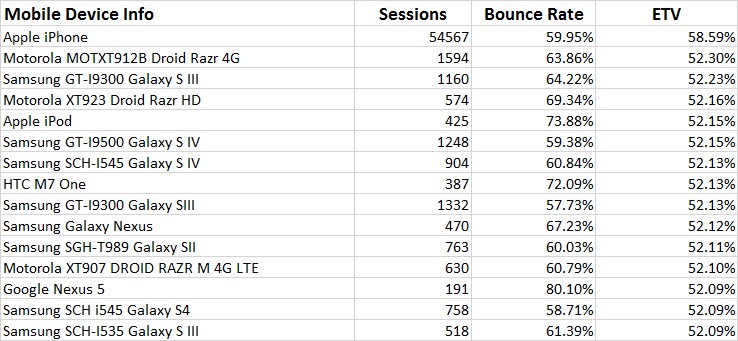
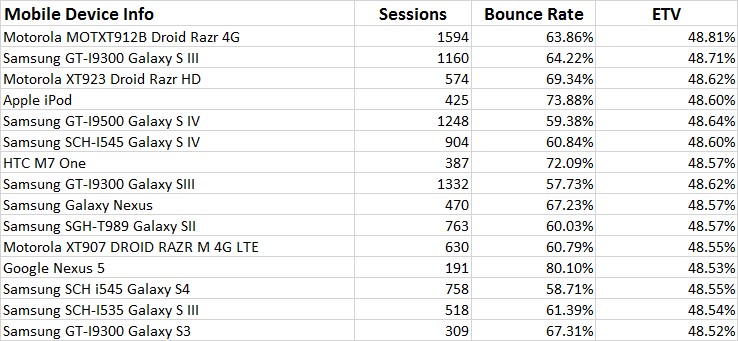
However, take a look at what happens when we remove the Apple iPhone data from that table and recalculate ETVs for rows 2 through 14. You’ll see that while the rows are close together in terms of Estimate True Bounce Rate, i.e. 48.81% to 48.52%, the estimate is now in the 48% range as opposed to the 52% range.
If you had all of the 922 rows of data in front of you and scrolled all the way down, you would see this.
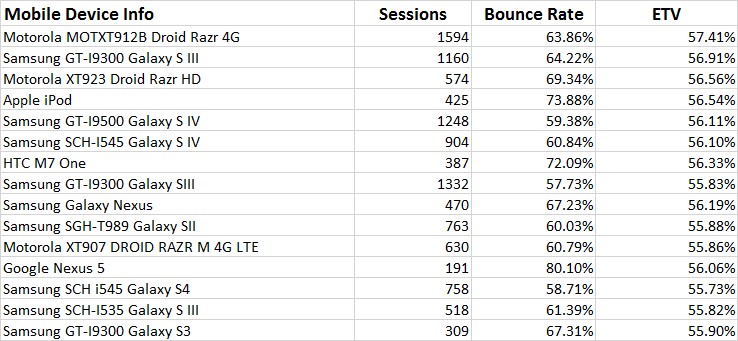
We’ll go ahead and remove that row as well and recalculate the ETV and show the top 15 rows again ranked by ETV. You would now see this and think that the Estimate True Bounce Rates are more like in the 55% to 57% range. The bottom line is that the ETV calculations are sensitive to rows that have very large numbers of sessions.
So, yes you may want to calculate the ETVs if for no other reason than to get a sense of how big the Estimated True Bounce Rate is because just having the rank order of importance that Google Analytics gives you doesn’t say how “relatively” important the row is. You should also be aware that large rows skew the data.
