How to use Google Analytics to support your public relations efforts and gain insight into the media
One of the biggest areas of discussion in the world of public relations is measurement. While simplistic approaches still look at Advertising Value Equivalencies (AVEs), we at Zion & Zion are generally uncomfortable with limiting PR ROI evaluation to just AVE. In this age of data and analytics, we need to embrace numbers and set measureable goals. With the media landscape becoming more and more digital every day, one tool that can be extremely helpful is Google Analytics. Yes. You read that correctly. You can use Google Analytics for PR evaluation.
If you’re not familiar with Google Analytics and how it works, it may seem a little overwhelming at first once you start to move beyond the basics, as Google Analytics is a powerful tool with most people only using about 1% of its capabilities. In this article, I’ll walk you through some of the basics of how this tool can support your company’s/client’s business objectives and show measureable results on your public relations efforts.
Gaining Access
Google Analytics (GA) is the most commonly used tool for measuring website performance. Each GA account has an account number, and each website under that account (a “property”) has a unique ID number. These numbers are placed in the HTML code of the website, which enables Google to track virtually everything people, more commonly referred to as “users,” do on the website.
In order to take advantage of Google Analytics, you’ll need access to it. Ask your webmaster to give you access by sending them your email address or Google account email. They’ll need to go in and add you as a user. At the very least, they should be willing to give you access under “Read & Analyze.” To do some of the things we’re going to discuss, you’ll need to have “Edit” access. If your webmaster isn’t willing to give you that level of access, we’ll provide you with a list of things you can ask them to set up for you instead.
Google Analytics—The Basics
Before we get started looking at the dashboard, let’s review some basic terms that you’ll need to understand in order to navigate the Google Analytics dashboard.
Terms
- User
- A user is a unique individual who visits your website. This information is tracked via cookie, so if someone clears their cookies, they’ll show up as a new user next time they visit.
- Session
- A session is one visit to the website. One user can have multiple sessions. By default, a session lasts until there’s 30 minutes of inactivity or the user exits the site. However, you can change this setting.
- Pageviews
- The total number of pages that have been viewed on the website. Each session typically contains multiple pageviews.
- Pages /Session
- The average number of pages a user sees in their session.
- Avg. Session Duration
- The average time spent on-site in one session.
- Bounce Rate
- A user “bounces” when they visit just one page of the website and then exit. It doesn’t matter how much they spend on that page. If they don’t go any further, it’s a bounce.
- % New Sessions
- The percentage of sessions that are initiated by new users.
- Event
- An event is an action that a user takes during a session on your site.
- Source
- The origin of your traffic such as a search engine (for example, Google), a referral from a website, a click on an email campaign, a click on a display banner ad.
- Medium
- The general category of the source; for example, organic search (organic), cost-per-click paid search (cpc), web referral (referral).
- Referral
- The specific URL path a user took to get to your site from a source (example.com/help/people.php).
- Channel Grouping
- A rule-based grouping of the most common sources of traffic, like Paid Search and Direct. This allows you to quickly check the performance of each of your traffic channels.1
Google Analytics is a very in-depth tool, and there’s a lot of information that you don’t need to view—or even understand—in order to accomplish your goals.
Now that you know some basic terminology, we can start looking at how these metrics can help you measure your public relations efforts.
Viewing the Dashboard
Once you log in to /Google Analytics, you’ll want to start with the Reporting tab (highlighted in blue at the top of the page).
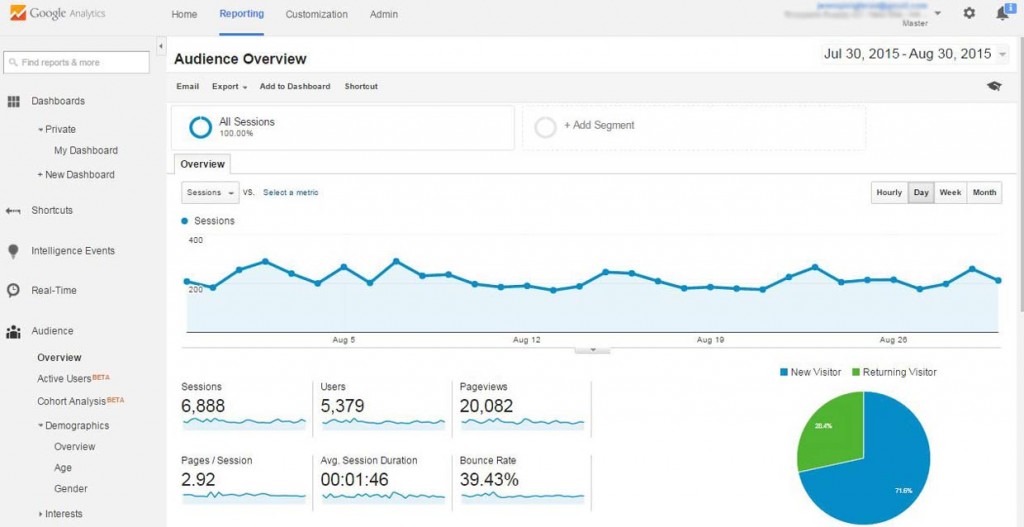
Take a look around using the menu on the left side of your screen to get an idea of what’s available. Once you’ve explored a bit, go back to the main menu—this is where we’re going to start. To get back here, just note that it’s under Audience – Overview.
Using Sessions to Measure a Campaign
The most basic way to use Google Analytics for PR measurement is to look for spikes in your web sessions following a press release distribution or media campaign. Not all media hits will include a direct link to your site, but they may inspire your target audience to look for it on their own. This is the hardest group to track, and is best for looking at results of overall PR campaigns or media blitz, versus a single hit.
Sessions are irregular from day to day, so in order to quantify a significant surge you’ll need to compare a few different data points. To make it easy, look at session numbers from the following: same time frame in the previous week, same time frame in the previous month and same time frame in the previous year.
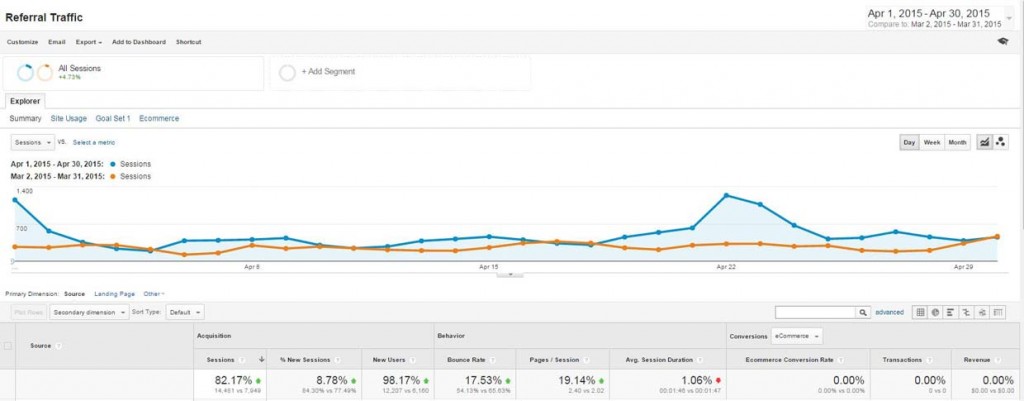
In the example below, we’re looking at a month-long campaign for a national nonprofit, so we’ll focus on month-over-month and year-over-year data. As you can see in the chart, there was a marked increase from the previous month in most categories. The campaign included social media and public relations efforts.
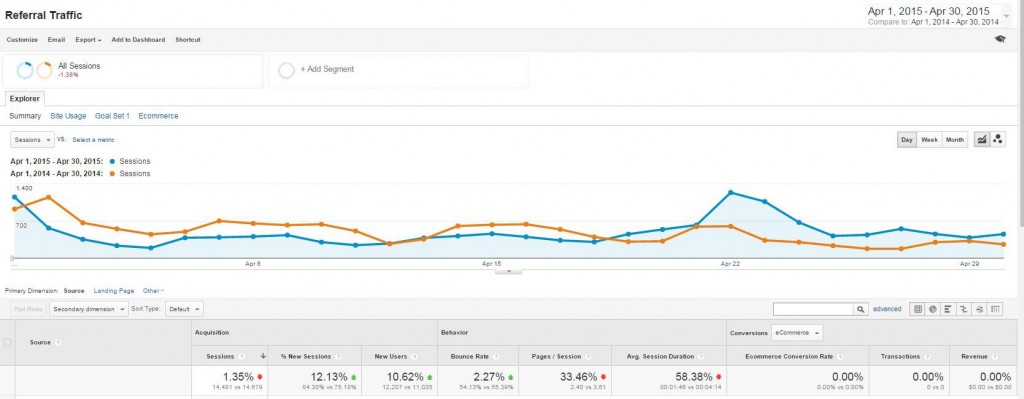
This is an annual event for our client, so it’s important to look at the year-over-year data. In the next chart, you can see that sessions were down slightly, so there was less traffic to the site. But of the users who came, more of them were new users, which is an important element to a nonprofit who has a major goal of awareness about their cause.
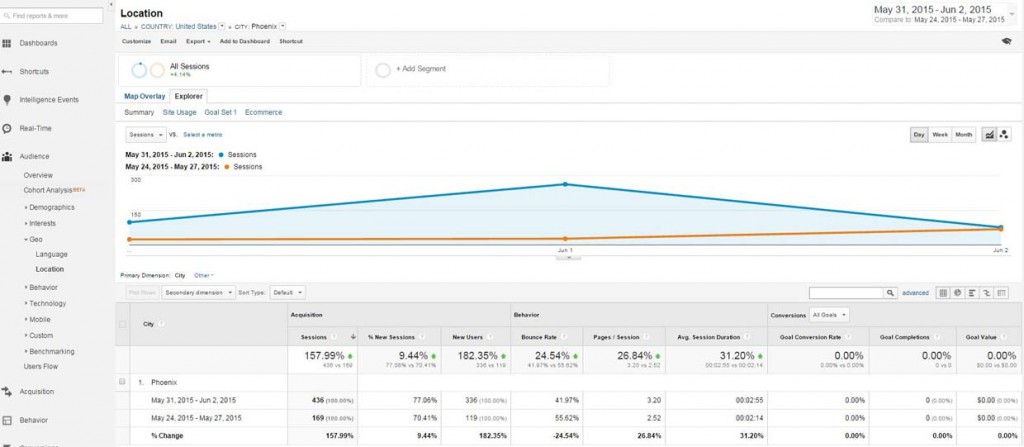
If you have a national client who had a hit in a specific market, or you want to see how a market was affected by a national piece, you can look at sessions from only that area. To view those sessions, go to the navigation pane on the left. Click on Audience and then Geo, and finally Location. You can review by Country, Region (i.e. States in the US), Metro, or City.
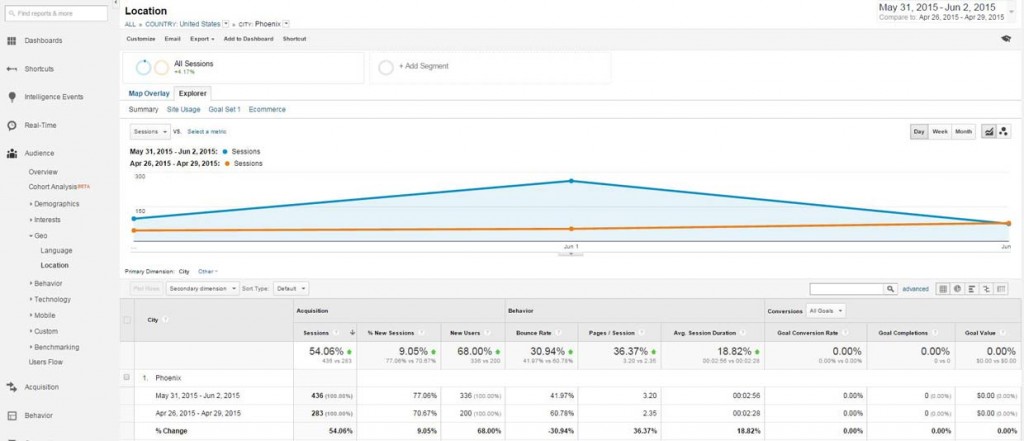
This example shows web traffic following a short media campaign for a client in Phoenix with multiple broadcast and print hits in just a few days. So let’s take a look specifically at the Phoenix area. When we compare to the week before, there’s an enormous traffic spike.
Previous Week
Previous Month
Previous Year
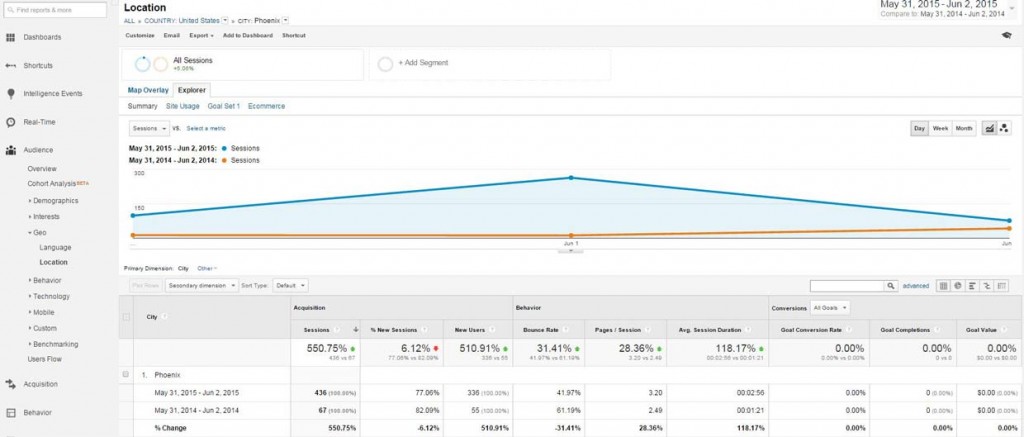
This campaign was 100% public relations in the Phoenix metro area; therefore, that additional traffic can all be attributed to the PR campaign: a 550.75% increase in web sessions over the previous year. That’s quantifiable data you can use to show the value of public relations to a CEO.
Direct Traffic from the Media
In the world of online media, journalists will often include a link to a company’s website in their article. While this doesn’t always happen, when it does, you have measurement gold. This technique only works when there’s an online story that contains a link to your client’s website.
For example, a nonprofit client of Zion & Zion had a big local story hit that was covered by multiple media outlets. Our local ABC affiliate covered the story and included a link to the client’s website. Using the Referrals report, we’re able to see that 76 web sessions resulted from this article. Those 76 people spent an average of 3 minutes and 36 seconds on the website, where they no doubt learned more about who the client is and how they could help. While not a direct donation, this is still a big win and a quantifiable way to show the value of public relations.
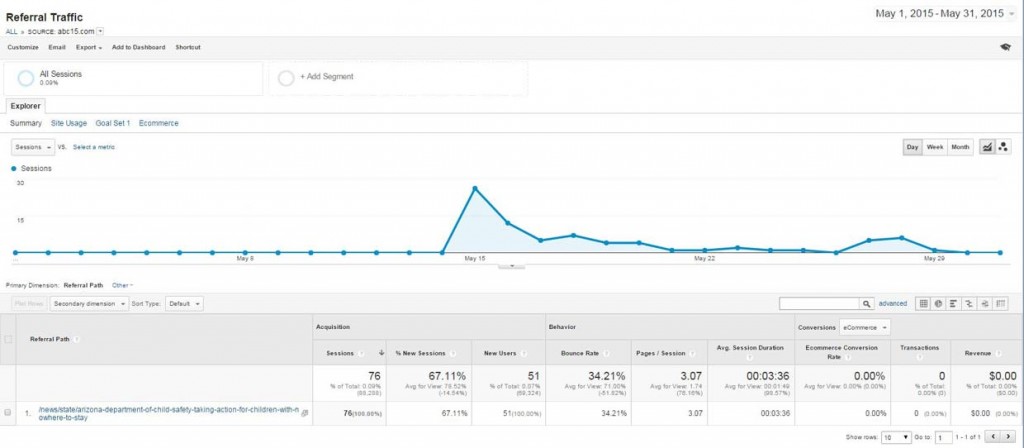
Now, I jumped ahead a bit, so let’s backtrack and I’ll show you how to find this information.
First, set your date range at the top of the screen. Be sure to include a few days before the piece. By now, you’re starting to get familiar with the navigation pane on the left. You want to look at Acquisition, as this is how people came to find your website. Next, select All Traffic. You’ll then see several options; we already talked about Channels, but this time I want you to look at Referrals.
Search through the list for the main URL of the site the article appeared on. For this example, we’re looking for abc15.com. This will show you all traffic that was referred to your site from this site during the given time period. If you double-click on the URL, it’ll break down the actual pages/stories that led people to your site. Easy, right?
Keep Organized with Annotations
One of the tools webmasters use in order to understand fluctuations in web traffic is annotations. Basically, anytime there’s a change made to the site (outside of content), they make an annotation. This can come in handy if you’re adding in press release distributions and large media hits. It’ll help with tracking the performance of an article over time, and show how it works together with other marketing pieces.
How to Tell if a Reporter Went to your Website
As a PR professional, one of the more frustrating issues we face is not knowing whether the reporter ever read our email. While GA can’t completely help you solve this problem, it can help give you a little insight. As part of your pitch, make sure that you include a link to the company’s website. Now here comes the interesting part: you need to create a custom URL that contains UTM tracking. Through this you’ll be able to see if the reporter ever clicked on that link. If they did, you’ll be able to see what they did on the site while they were there.
Before we talk about how to build one, let’s explain what it is in a bit more detail. UTM codes, sometimes referred to as UTM parameters, are little snippets of text added to the end of a URL that allow you to track its use. You often see them used in e-newsletters and paid search.
An example of UTM codes is bolded in the URL below:
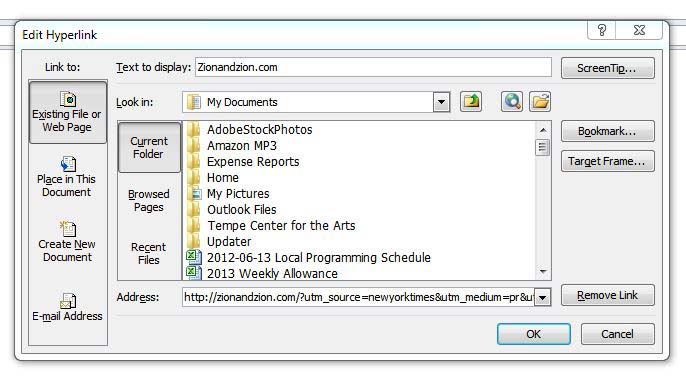
http://zionandzion.com/?utm_source=newyorktimes&utm_medium=pr&utm_content=johnsmith&utm_campaign=productlaunch
Adding the snippets of code after the question mark doesn’t affect anything on the page—it just lets your analytics program know that someone arrived through a certain source or overall marketing channel as part of a certain campaign.
Here are the five things2 you can track with UTM codes:
- Campaign
- Groups all of the content from one campaign in your analytics. Use this to categorize what the campaign is about, such as the launch of your new product or event.
Ex: utm_campaign=product launch
- Source
- Which outlet the pitch is being sent to
Ex: utm_source=newyorktimes
- Medium
- The type of marketing medium the link is being used for. Make it simple and just use pr.
Ex: utm_medium=pr
- Content
- Used to track the different types of content that point to the same URL from the same campaign, source, and medium codes. For our purposes, we’ll use this to highlight the name of the reporter it’s being sent to.
Ex: utm_content=johnsmith
- Term
- Used to identify the keywords you’ve paid for in a PPC ad. Just leave this blank. You don’t need to use every field.
Google makes creating a UTM code easy by providing a UTM builder. Just plug in your terms and it’ll generate the link for you. This will take a little bit of extra time when you’re pitching, but it’ll pay off in the end by providing you with more insights.
When you include your link, make sure to only have it display the regular URL. Most email programs allow you do this. In Outlook, type the regular URL, highlight it, and then right click. Select Hyperlink. At the top, you’ll see the text it will display. At the bottom, you can input your custom URL.
You can check Google Analytics every morning to see if any new hits have appeared. If so, that’s a great time to follow up with a reporter. There are two main ways to look at this information in Google Analytics. The fastest way to get an overview is to look under Acquisition. Then select Campaigns, followed by All Campaigns.
You’ll see your campaign (product launch) listed. Click on it to see a breakdown.
You can also provide a custom link if a website is willing to use your tracking URL within their story instead of a regular link. Some might, some might not.
Settings Up Goals and Events for Measurement
All of this tracking is great, but while we’re busy pushing people to the website, what does it all really mean? How can you tie this into your company’s business objectives?
First, let’s take a look at what your overall business objectives are, either for yourself or your client. For this example, we’ll once again use a national nonprofit. Below is a very basic list of what they’re looking to accomplish.
- Donations
- Awareness
- Volunteers
How can we measure our PR success against those basic objectives? Google Analytics makes it easy with a feature called Goals. It’s possible that your webmasters have already set this up, so check with them first before diving into anything. Each Google Analytics property is allowed 20 goals total, so you’ll want to use them sparingly.
What are goals?
Goals are a versatile way to measure how well your site or app fulfills targeted objectives. You can set up individual Goals for discrete actions, like sessions to a “Thanks for registering!” page, a “Download completed” screen, a minimum session duration, or a specific purchase amount.
Why set up goals?
You can measure conversions, or completion rates, for each Goal you set up. Combine Goals with Funnels to analyze user actions leading up to a Goal. If you set a monetary value for a Goal, you can also see the value of conversions.3
Goals let you assign a dollar value to a particular action that occurs on your site. E-commerce sites are easier, as they already have values set, but you may have to get a little more creative if you don’t have an e-commerce site.
Let’s go back to the list and break them down individually to see how it can all relate.
Donations
If the nonprofit’s website is set up to accept online donations, this is very simple to track. It functions just like e-commerce. For example, think about all 76 web sessions that resulted from the ABC hit. We can track how much money they donated through the website. If donations aren’t accepted online, you’ll need to track donations separately and line them up with the web sessions outside of analytics.
Awareness
When dealing with an important cause or a client’s new product, sometimes your goal is to increase awareness. The easiest way to gauge awareness is by looking for an increase in new users. New users are people who have never been to your site before, so their visit indicates an increase in awareness of your cause or product. You can also look at the number of sessions in total and the average time on site, comparing them to previous periods of time (week, month, or year). This will include previous visitors who are coming back to the site to learn more.
One important item to note on new users is the way that Google tracks data. New and returning users are tracked via cookies placed on a browser. Whenever someone clears their cookies, the next time they visit the site, they’ll be flagged as a new user even though they’ve been to your site before. However, this number is typically not high enough to affect the validity of your data.
Volunteers
When it comes to nonprofits, you can never have enough volunteers. In order to track this, there needs to be a page for people to sign-up or contact the organization for volunteer opportunities. Outside of Google Analytics, you could ask your client to provide you with weekly numbers on volunteer forms received or calls about volunteering. Oftentimes these numbers can be difficult to get out of a client, so Google Analytics is a great alternative.
The easiest way to track this is to view the sessions where visitors went to the volunteer page. This can be done by looking at Behavior, then Content Drilldown. Just as you would navigate through a site, you can click through the URLs in Google Analytics to find the page that you’re looking for. This will give you an idea, but not the whole picture (or a truly accurate one).
If you’ve already started a relationship with your webmaster, then there’s another option. Speak to them about adding a thank you page for completed sign-ups. Then have them add the URL of that page as an event. From there, you can look at that particular event in Google Analytics to see if there was an increase in the number of submissions following your efforts.
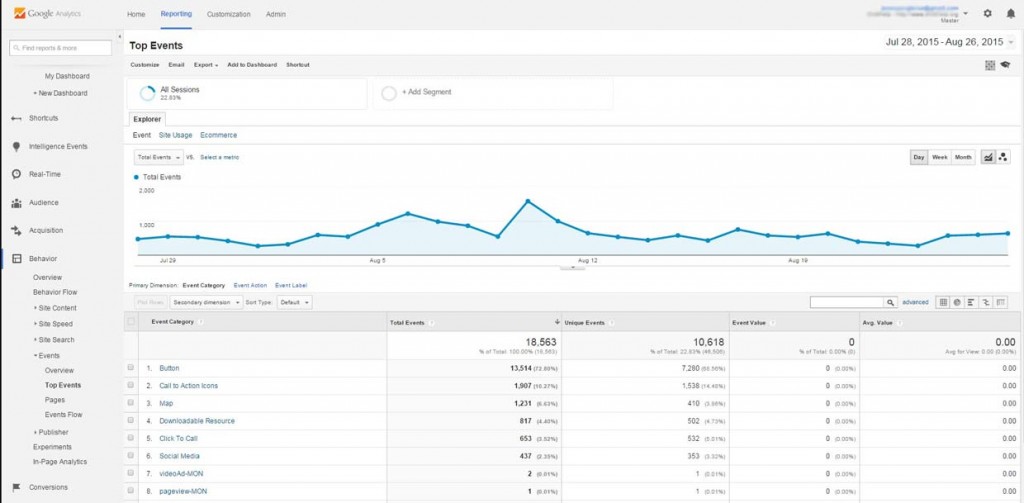
Events are a great way to track a user’s actions and behaviors while on a site. Events are user interactions with content that can be tracked independently from a web page or a screen load. Downloads, CTA (call to action) clicks, form submissions, and video plays are all examples of actions you might want to track as events.
Decide what actions you want people to take once they arrive on the site, based on your goals. Then talk to the webmaster about how to track those actions using events. It’s quite possible that they’ve already been set up, so the web team can monitor performance per the company’s objectives.
Once you have events set up, you can access them under the Behaviors section. Your webmaster will tell you the category name that was assigned to your events to allow you to easily watch their performance.
How to Turn This Data into a Report
So you have all this data, but how do you pull it all together? As we’ve established, each case is going to be a little different based on what your objectives are for you or your client. We’ll use the sample chart below from our nonprofit client to show you how we might organize a report.
You’ll still want to include your usual PR metrics including audience, tone, etc. but we’re just going to focus on the information that can be gleaned from Google Analytics for now. Since our objectives revolve around Donations, Awareness, and Volunteers, the metrics we report on are going to center around these areas as well. Most items are shown as a percentage increase or decrease.

Below is a breakdown of the categories:
General:
Traffic from Article—this is direct traffic that came from the URL of the article.
Avg. Session Duration—this is important to note because if the direct traffic bounced or spent very little time on-site, they most likely didn’t perform any actions we wanted them to.
Awareness:
With awareness, you’re dealing with indirect traffic, so we’re looking at the impact during a certain timeframe. Note that in the sample chart above, there were a number of hits on the same day for a local news story. We’re using general figures that apply to all media on that day.
Users WoW (week-over-week)—this is an overall number of users that visit your site. We’re looking at the date of the article +6 days and comparing it to the week before the article.
Sessions—this is the number of times the site was visited in our time frames: WoW and YoY (of the article +6 days and comparing it to the same week of the previous year).
Spot Market Sessions—since this is a national client that operates chapters in various markets and gets a good amount of local/regional coverage, we also want to track this information on a smaller level.
Donations:
Here we’re tracking overall donations by noting visits to the donations page, since their donations are run by a third party system. Again, we’re looking at both national and spot markets.
If your client has enabled e-commerce functionality, you’ll be able to track actual dollar figures. Or if you were able to assign a value to this goal based on the average amount of an online donation, you could track dollar figures over pageviews.
Volunteers:
We’re tracking volunteers by measuring traffic to the volunteer sign-up page, since that’s also being run through a third party system. We focused on spot market here as all coverage was from two local markets.
You can look at these figures in different date ranges if you want to look at an overall campaign as well. Try building your own report sample for a client based on their objectives, and see what you can find out about the performance of your PR efforts.
Summary
While this is certainly not an exhaustive tutorial on Google Analytics, these tips are a great starting point for incorporating some real numbers into your public relations reporting. Showing how your PR efforts have impacted a company’s goals gives you credibility with executives, as well as hard data you can use to get approval for budget increases, or to expand a successful local campaign on a national level, or for other public relations opportunities you want to pursue.
Additionally, it can allow you to see how intriguing your pitches are by tracking how many journalists are using your custom links to visit your (or your client’s) website.
If you want to learn more about Google Analytics, check out Google Analytics Academy.
1 https://support.google.com/analytics/answer/6086078?hl=en
2 /http://blog.hubspot.com/marketing/what-are-utm-tracking-codes-ht
